

Are you curious how your cesarean rate stacks up to the national average? How about your VBAC...
.png?width=700&height=540&name=stats%20cheering%20(8).png)
You asked, we listened!
We are very excited to announce some exciting stats updates to our new report pages View Stats and Compare Stats (formerly Tabular Data and Comparative Data).
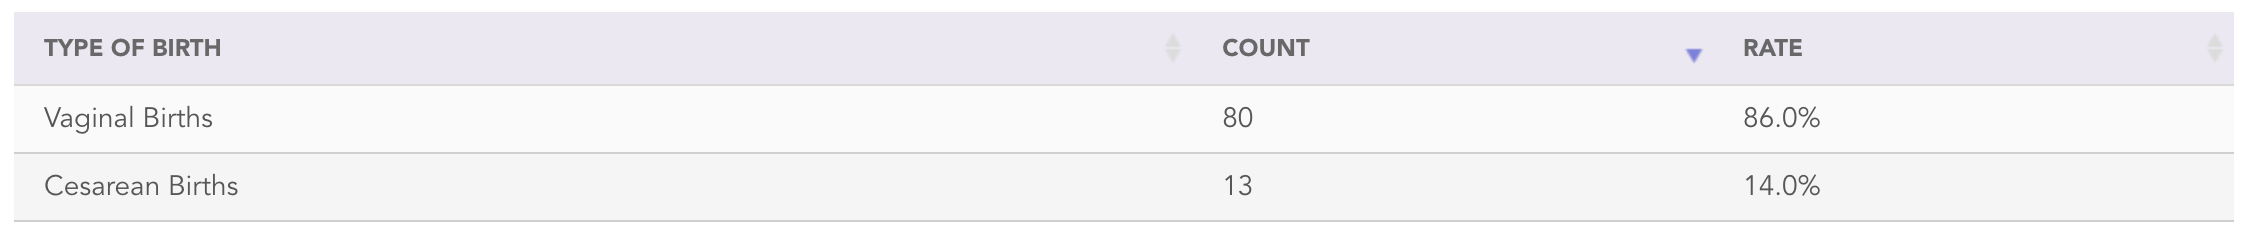
Rates added in addition to summative totals
Want to know how many cesareans you did last month along with your C/S rate? Now you can view both of those in View Stats. The View Stats and Compare Stats pages will display the summative total (how many times did that variable occur) and your rate (%).
Exclude N/A option added
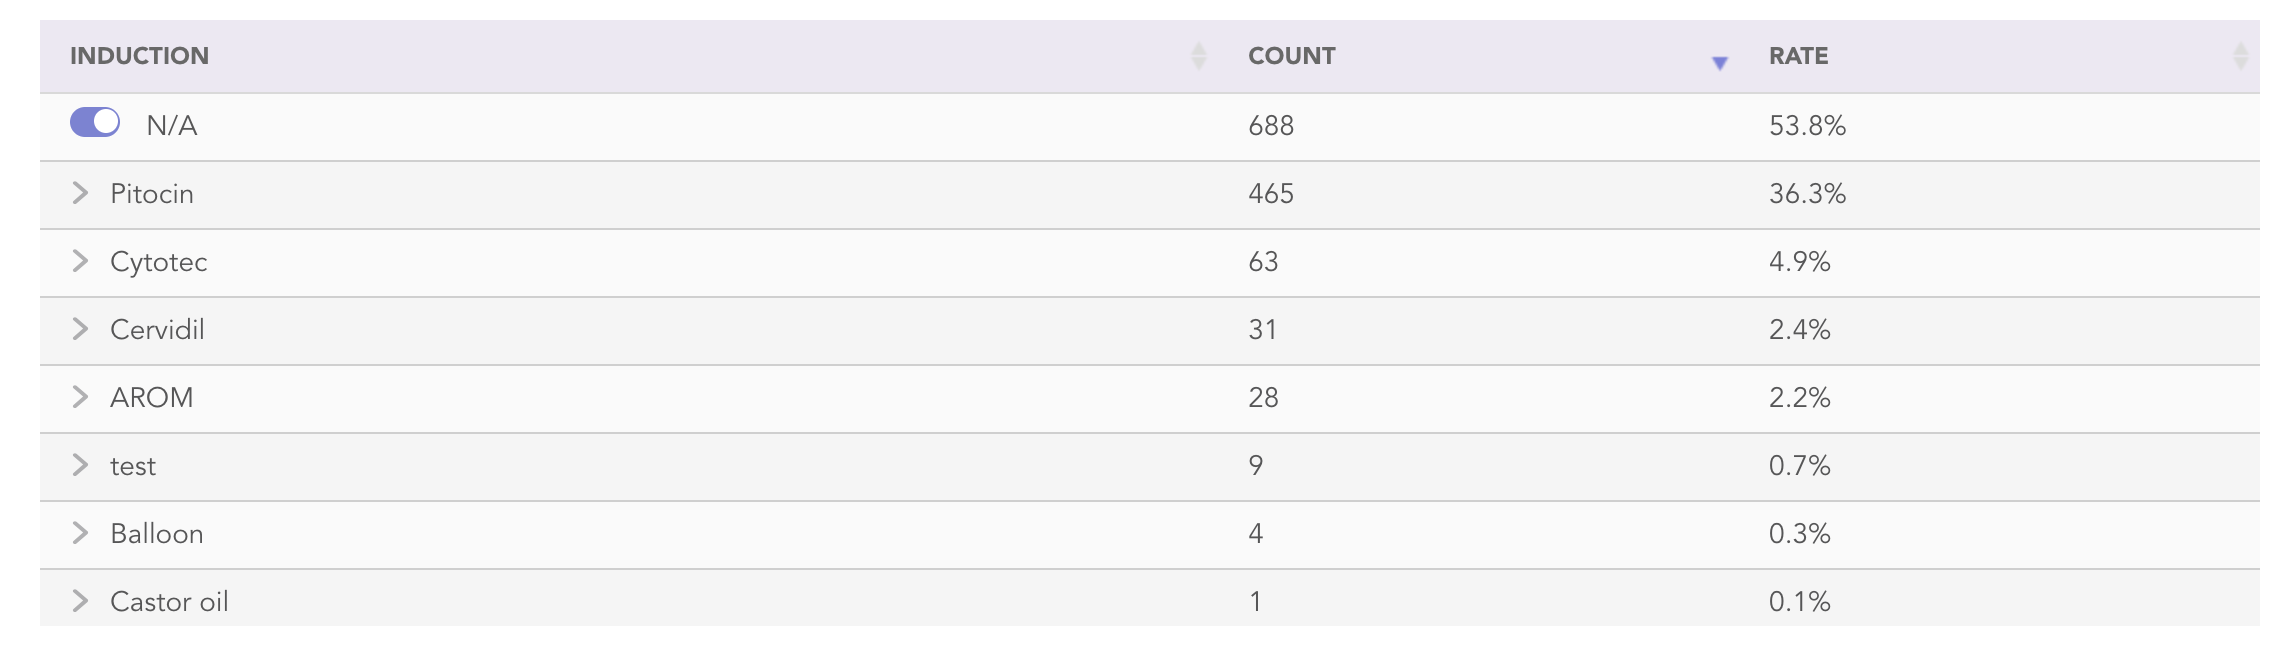
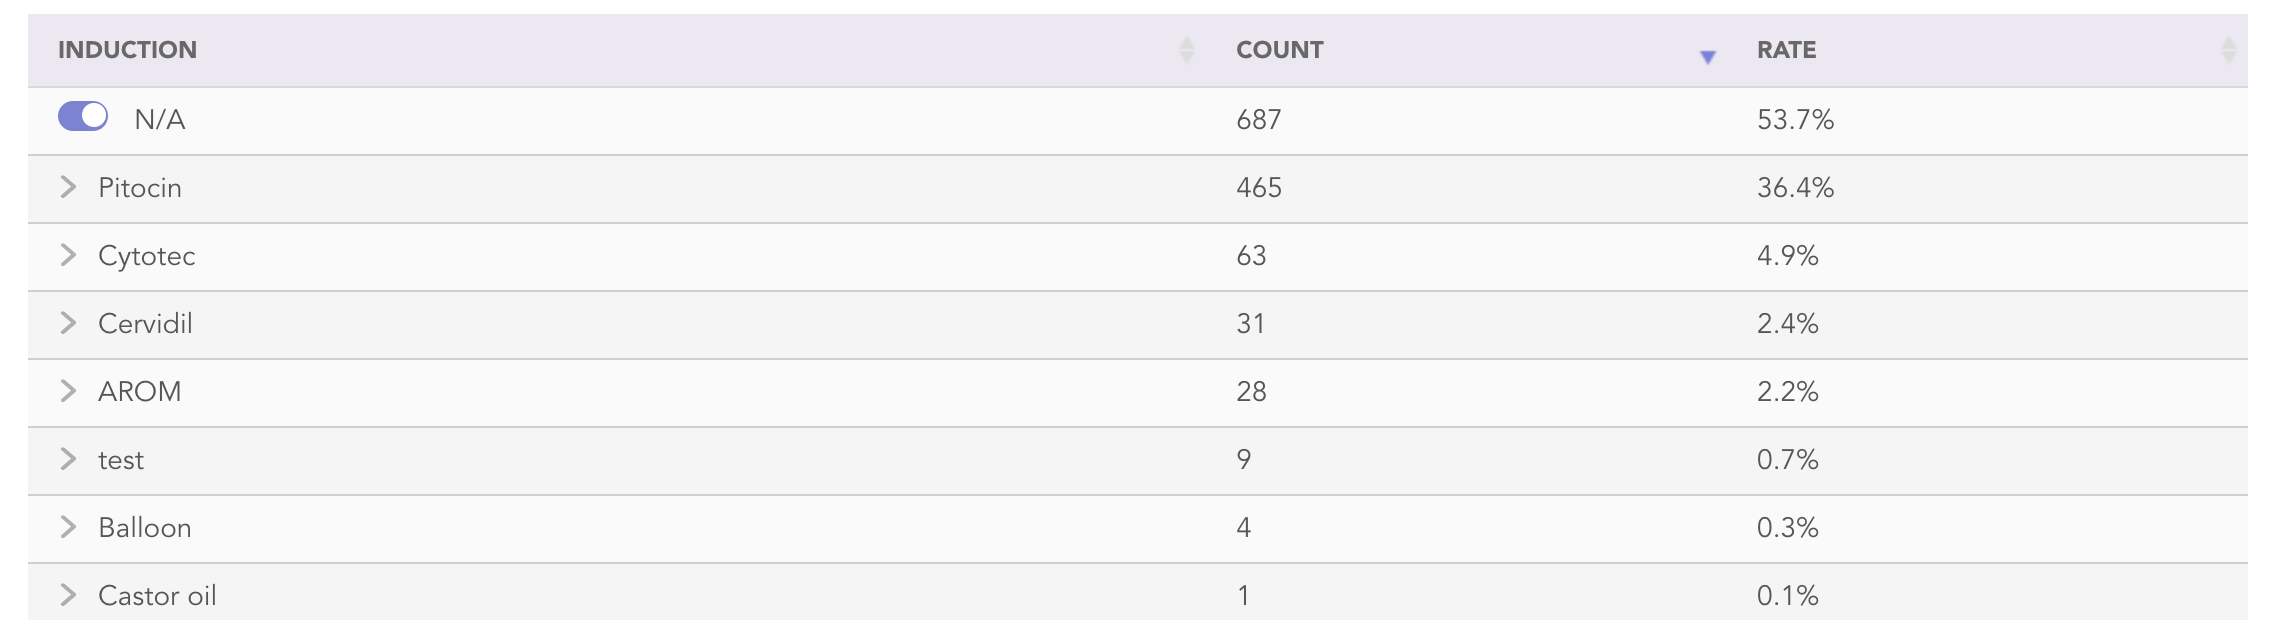
When a field is skipped it, the entry registers as N/A. In View Stats, the N/A reflects the number of births in which that field was not applicable. By default, the N/A is included in the rate calculation in the denominator. If you want to exclude the N/A from the rate calculation then click on the toggle switch next to N/A. You'll notice the numbers change. This is already an option on the Summative Graphs page.
Example: If you want to know what percentage of your inductions used a certain induction method, you would want to exclude non-inductions in that calculation so you should exclude the N/A.
The first screen below includes N/A. We can see that 36.3% of our births were on Pitocin.
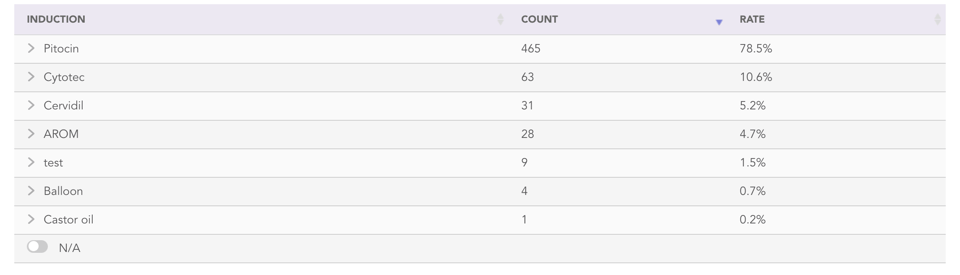
Notice how the calculation changes in the second screen when we exclude N/A. Now we can see that 78.5% of our inductions were on Pitocin.
Multiple choice fields are easier to interpret
In the past, multiple choice fields only showed the various combinations but it took some manual addition to determine how many times a variable occurred in total. Now we've added the ability to see the grand total of a variable and also the combinations.
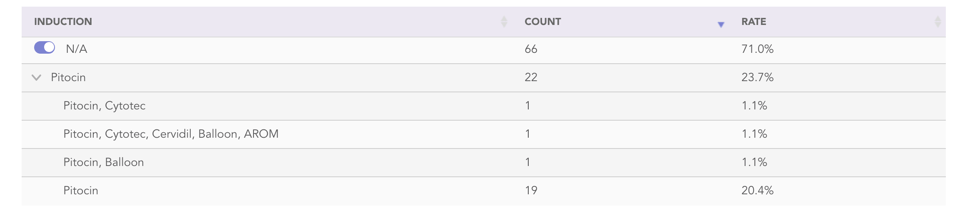
The default view will show you the grand total. Click on the arrow to the left of the variable to expand to see all the combinations.
Example: In the screen below we see that 22 patients were on Pitocin. Of those 22 patients, 1 had Pitocin and Cytotec, 1 had Pitocin, Cytotec, Cervidil, Balloon and AROM, 1 had Pitocin and Balloon and 19 had only Pitocin.
Menu Simplified
We revamped the menu options to enhance clarity and user-friendliness. Simply select which type of data you're interested in viewing, which delivery provider, and the timeframe of the births.
Pro Tip: Under Delivery Provider, you can select All Practices to view the aggregate data of all practices in BirthTracks. This is a great way to benchmark your outcomes stats.
We also moved the filters to a Add Filters button. This used to be titled "Where:" (see below). You can use filters to look at data about a certain patient population group.
.png?width=960&height=645&name=Frame%201%20(4).png)
Example: To view data about your inductions, click Add Filter and choose Induction is ANY. Now you can see what your cesarean rate or your hemorrhage rate was for your inductions.

Compare Stats gets the same updates
Now you can compare the rates of two variables in addition to their totals.
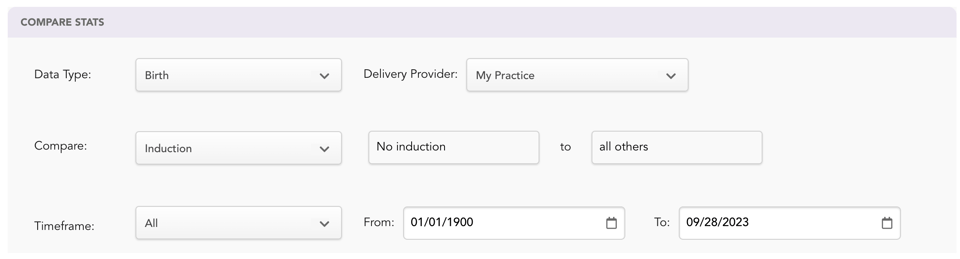
Click on Stats > Compare Stats. Select the type of data you want to view, the delivery provider (you can select My Practice to include all births from the practice), the timeframe of the births, and choose the two variables you want to compare.
Example: To compare the outcomes of your inductions vs non-inductions, select Compare: Induction. The "all others" are inductions.
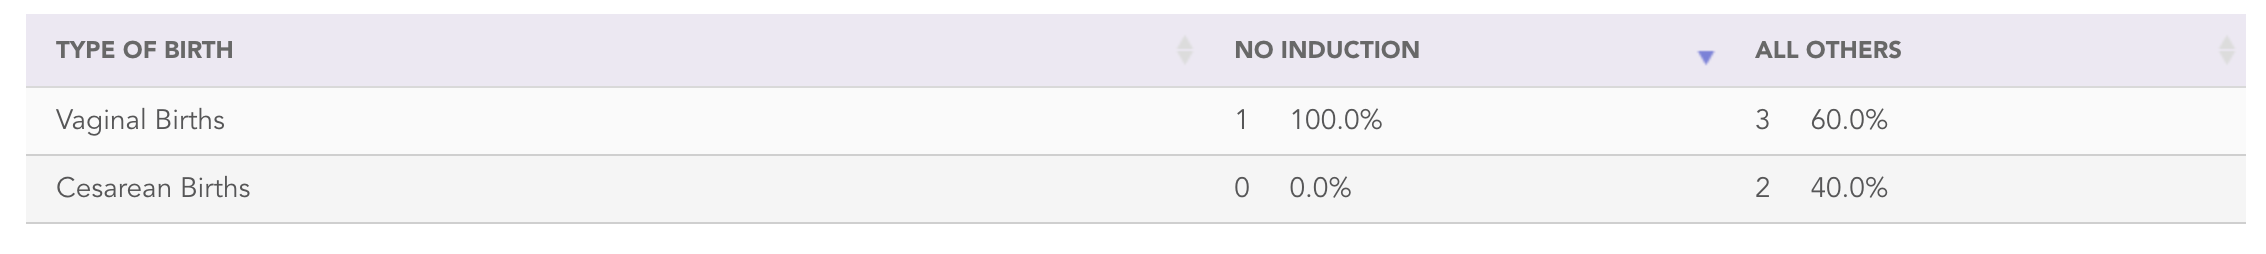
In the screen above we can see that of our 5 inductions, 2 were C/S which is 40%. We only had 1 birth that was not an induction and they delivered vaginally.
Other common variables to compare are: birth site, prenatal site, type of birth, delivery provider, and race.
Ready to try out the new features?
Need more assistance?

.png?height=200&name=EHR-BT-ACNM%20Infographic%20(6).png)